Symbolizing geospatial data with QGIS

QGreenland Researcher Workshop 2023

Symbology is important

Symbology is critical to understanding data! Consider:

  • Does your colormap look uniform across your values?
  • Do your symbology choices unintentionally exclude any users, for example people with Color Vision Deficiency (CVD), a.k.a. “colorblindness”?
  • What, aside from your data, will be in your visualization?
    • Basemap?
    • Other data elements?

Colormaps

Perceptual uniformity

Jet and Rainbow are common, but “lie” about your data.

Jet’s perceptual derivative shows high rate of change (red) some places, low rate of change others (green)

Viridis’s perceptual derivative is consistent

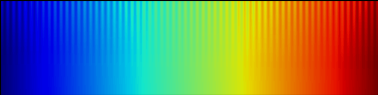
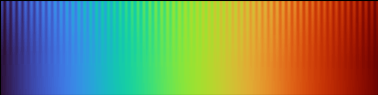
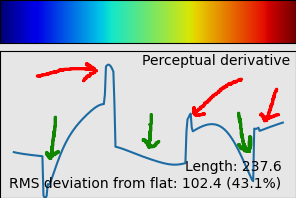
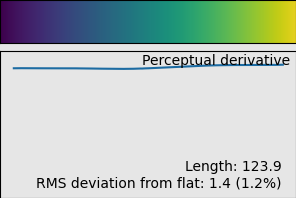
viscm, software used for analyzing colormap quality, was used to generate these images.

Good places to start

  • cpt-city: A website with lots of colormaps, some better than others.
  • SVG2ColoR: A plugin available from the official QGIS plugin repository for loading SVG styles from various sources (e.g., cpt-city).
  • cmocean: All perceptually uniform, some CVD-friendly.
  • Colorcet: All perceptually uniform, some CVD-first.
  • ColorBrewer: All perceptually uniform, most CVD-friendly.
  • CMasher: All perceptually uniform, some CVD-friendly.
  • matplotlib: Some perceptually uniform, some CVD-friendly.

Colormap set up in QGIS

Some high quality colormaps (e.g. Viridis, Cividis, Magma, Inferno, and Plasma), are built in, others need to be installed.

cpt-city and ColorBrewer in QGIS

Settings > Style Manager > “+” button > Catalog: cpt-city

Add a style

List styles by author, then select cmocean

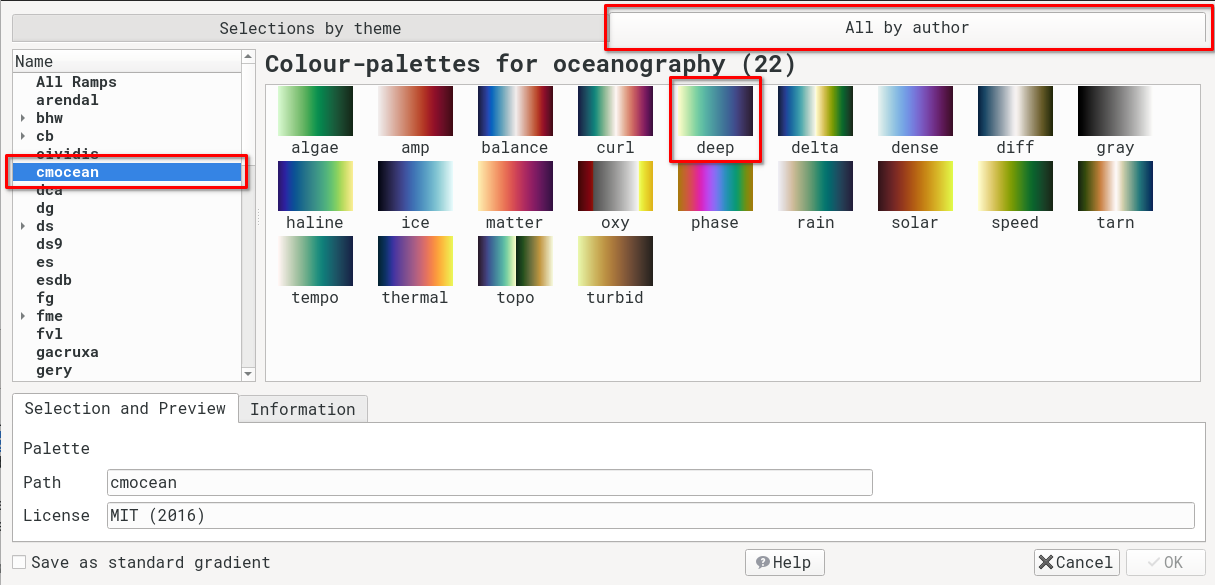
Adding “deep” colormap
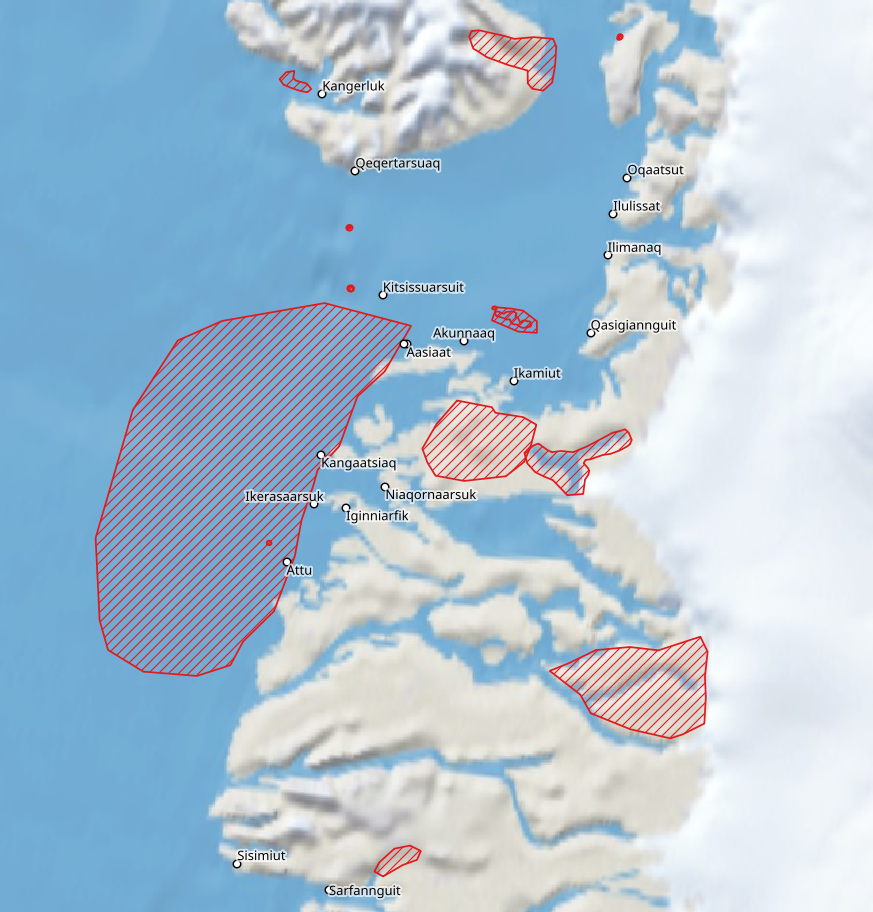
Vector symbology

Colormaps are important for symbolizing vectors as well as rasters, but vector data have some other unique concerns.

Symbolizing shape

  • Markers: color, shape, size
  • Lines: color, thickness, pattern
  • Fill: color, pattern
  • Clustering: physical proximity

The Bird protected areas layers use hatch-filled polygons to indicate areas that may have restricted access

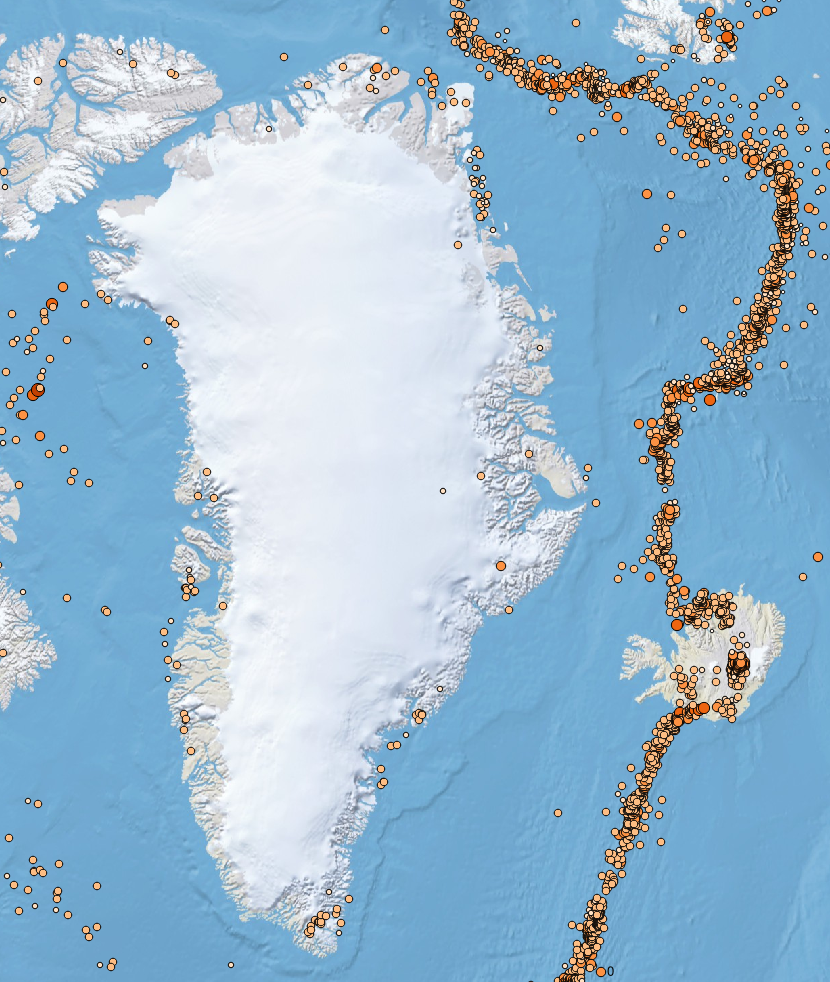
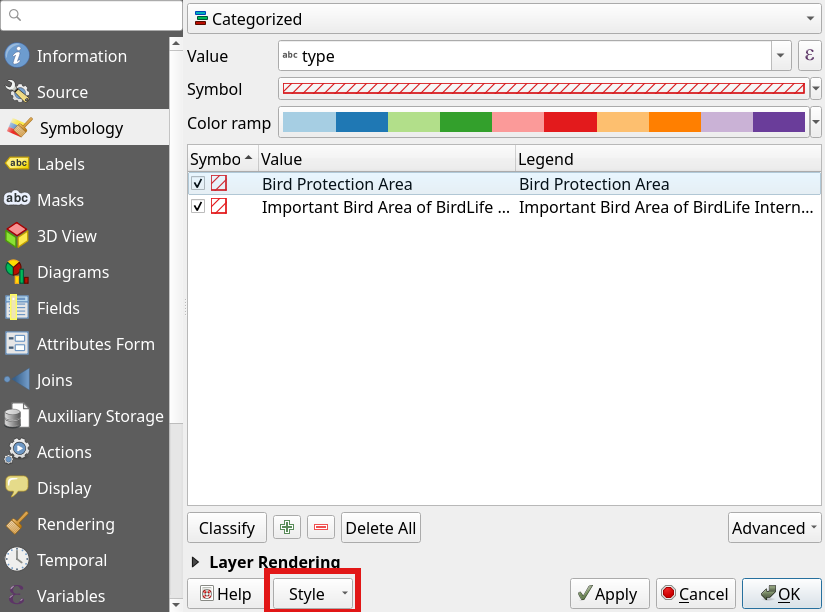
Symbolizing attributes

  • Labels: e.g. placenames
  • Marker size: e.g. scalar value
  • Color: e.g. scalar value
  • Scale-dependent rendering

The Earthquakes layer uses size and color to indicate magnitude.

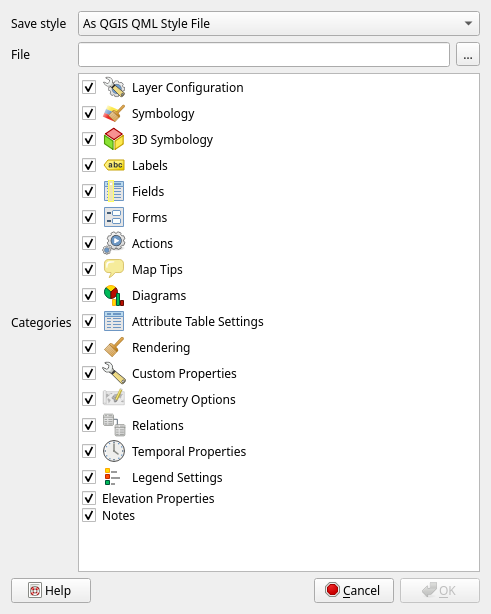
Exporting QGIS symbology

QGIS supports importing and exporting symbology choices as QML files.

Use the “Style” dropdown in the layer’s Properties window

The “Save Layer Style” interface. Note that the “Load Style” interface looks similar.

Exporting QGIS layer definition

QGIS supports importing and exporting a layer’s definition (symbology and pointer to the data ) as QLR files.

Particularly useful for layers that you want to share that are accessed via the internet (e.g., a WMS layer).

  • To create a QLR file, right-click on a layer in the Layers Panel, then select “Export > Save as Layer Definition File”.

  • To import a QLR file, use the Layer menu (“Layer > Add From Layer Definition File”)

Exercises

💪 Exercise: Symbolizing datasets together

20 minutes

💬 Discussion: On symbology decisions

20 minutes